Half of Firearm Murders Hit 2% of US Counties, Mostly Blue Ones
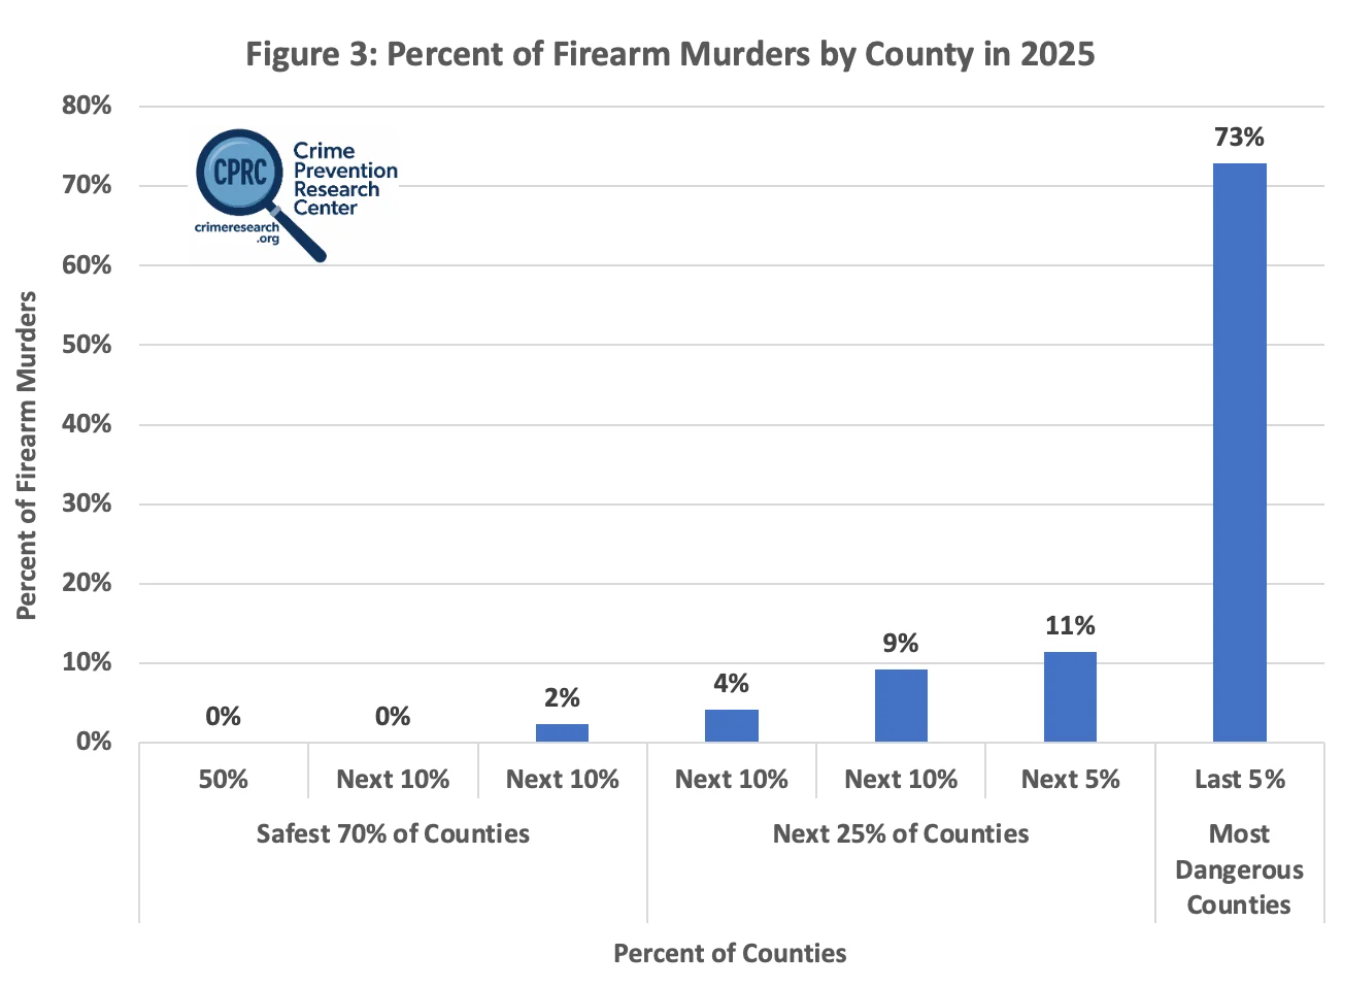
The Crime Prevention Research Center says 57% of firearm murders in the United States happen in just 2% of its counties. CPRC President John Lott's latest study found that share runs higher than the 53% of all murders that land in the same group of counties. Most of those counties voted for Biden in 2020. Most of their murders happen inside major cities run by Democratic officials. The data lands while the national murder rate sits at or near record lows, which makes the concentration the real story for anyone who carries.
Key Details
The study breaks the country into counties and ranks them by murder volume. The findings break down like this:
- 53% of all murders occur in the top 2% of counties.
- 57% of firearm murders occur in that same 2%.
- 1,981 counties with 17% of the population recorded zero firearm murders.
- 453 counties with 8.92% of the population recorded one.
- 78% of counties recorded zero or one firearm murder.
- 4.9% of firearm murders occurred where 25.97% of Americans live.
- The worst 1% of counties accounted for 40% of murders in 2025, down from 41% in 2024, while holding 20% of the population.
- The worst 2% accounted for 53% of murders, down from 54%, while holding 30% of the population.
Lott wrote that murders fell faster in the counties with the most killings as the national murder rate dropped to record lows in 2025. The report also says murders cluster inside small areas within those high-murder counties. For the worst 1% of counties, the report says major cities account for an average of 74% of county murders, excluding places where city and county boundaries match. The report also notes that the 31 worst counties went for Biden in 2020, except one that Trump carried by 1.1 percentage points. In 2024, Harris carried 25 of those 31 counties.
Background
The Crime Prevention Research Center has tracked crime data for years, and Lott founded the group after publishing More Guns, Less Crime in 1998. The organization has examined how murders concentrate geographically before. This study narrows the focus to firearm homicides, a category the group had not isolated in earlier work.
The timing matters. Violent crime has fallen sharply from its early-1990s peak, and the murder rate hit new lows in 2025 according to the report. Gun control advocates have pushed for new restrictions during that same stretch, arguing that crime demands action. Lott's data complicates that argument by showing the violence sits in a small set of places, most of them governed by the officials pushing those restrictions.
Legal context also shapes the debate. In New York State Rifle & Pistol Association v. Bruen (2022), the Supreme Court ruled that gun regulations must match the nation's historical tradition of firearm regulation. Courts now examine whether a law fits that tradition, not whether lawmakers say it reduces crime.
Why It Matters for Gun Owners
If you live in a major city inside a Democrat-run county, this data hits you directly. Those counties concentrate the homicides, and they also write the carry permit rules, the local ordinances, and the policing priorities. Expect local officials to cite this kind of data when they push new restrictions on lawful carry. Expect them to cite the same figures to justify expanded police budgets, too.
Rural and suburban owners in low-murder counties face a different question. The report shows most counties record zero or one firearm murder. Those residents should not assume that a state-level ban or a new permit rule reflects their local crime picture. Track your county commission and sheriff's budget meetings, because local spending decisions often matter more than headline legislation.
Watch for the next phase of this argument. Gun control groups will likely read the concentration data as proof that cities need tighter controls on firearms. Gun owners should answer with the report's own numbers: the study shows that murder concentrates in specific places, and it does not show that legal gun ownership causes murder.
DownRange Analysis
The study proves concentration, not causation. Knowing that 57% of firearm murders occur in 2% of counties does not tell us why. Poverty, gang activity, drug markets, and policing levels all cluster in the same places. Lott's team stops short of claiming gun laws cause the pattern, and gun owners should hold their own arguments to that same standard.
Bruen changes how this data should be used in court. A judge asking whether a restriction fits historical tradition will not care that a county had high murder rates. Concentration data may help a city argue for a local response, but it does little to justify a broad statewide ban on carrying in common places.
Right now, do three things. Check your county's murder data on the CPRC report and your local police open-data portal. Track ballot measures and city council votes that touch carry rules. Join or support the state gun rights group that litigates these ordinances. Numbers win arguments only when someone shows up to use them.